Even before the markets tumbled in March mainly due to the impact of Covid-19, pundits suggested 2020 would usher in an environment that would favor active managers. So, it’s natural in the midst of heightened volatility that investors’ eyes would turn toward active management to ask – are active managers outperforming during the crisis?
Indeed, there are early signs that active managers are doing well in this time of market turmoil as noted by Bloomberg in “Once Again, It’s During a Stock Rout That Active Managers Shine.” And many pundits theorize active managers are likely to outperform during periods of volatility – as explained by S&P Global in “Showtime for Active Managers?” which examines how high dispersion and high correlations work in active managers’ favor. We caution that short term data most likely will not be meaningful to answering any questions about active or passive, and it will take time to see how everything plays out.
However, while the factors driving active and index performance are complex, data suggests that the average actively-managed fund tends to do better in more turbulent economic environments, while the average index fund often outperforms when the economy is strong.
This chart shows the average relative performance of active large blend funds and index funds over a 30+ year period, from 1985 through 2018. Specifically, it looks at the performance of funds in the Morningstar Large Blend funds that are not index or enhanced index funds (“active large blend”) and compares it to the performance of funds in the Morningstar S&P 500 Tracking category (“index”).
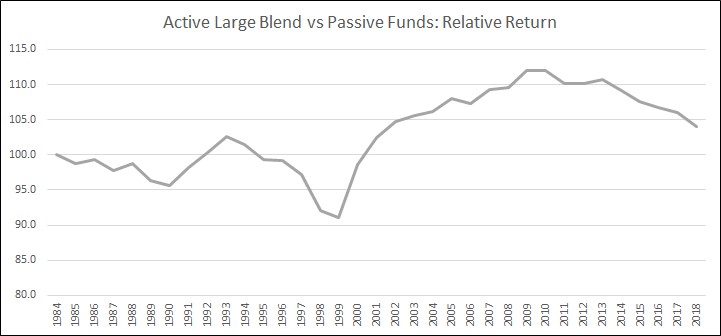
Exhibit 1 illustrates the multi-year cycles of relative return between active and passive strategies in the large cap blend universe from 1985 through 2018. It divides the cumulative return of Active Large Blend funds by the cumulative return of S&P 500® Index funds; both are indexed to 1984 (= 100). A rising line indicates outperformance of active strategies while a falling line indicates underperformance of active strategies. (Source: Harding Loevner)
When the line is rising, the average active large blend fund is doing better than the index funds; when the line is falling, the average index fund is outperforming active large blend funds. Here’s what it shows:
- Late 80s and early 90s: Index funds outperformed in the latter half of the 1980s and into the early 1990s, when the economy was recovering from the long recession of the 1970s and early 1980s.
- Mid 90s: Active funds were strong in 1992-94, as the economy dipped into a mild recession and then began to recover.
- Late 90s: Index funds again outperformed during the boom years that marked the balance of the 1990s.
- The Naughts: Active funds regained momentum during the more turbulent years of the 2000s, a period that included a brief recession (2001 to 2003) and the more severe downturn accompanying the financial crisis.
- The 2010s: As the economy began to recover from the turmoil of the financial crisis, index funds began to outperform again.
So, what should investors take away from this data review? First, most investors should be thinking long-term when making investment decisions. Second, active has tended to perform better than passive during periods of market turbulence – leading to point three: holding both actively-managed and index funds in a portfolio could reduce volatility across economic cycles.